Checks & Incidents
Track reachability, email delivery, and availability. Investigate issues, send alerts, and publish a customer-facing status page.
Explore Monitoring Robin Suite
Robin Admin / Operations Platform
Monitor services, explore telemetry, investigate email authentication reports, and operate your mail estate from one self-hosted workspace.
Use Admin independently for monitoring, metrics, or reporting—or bring those capabilities together with service operations. The Robin suite is one way to deploy it, not a requirement.

Four Ways to Put Admin to Work
Start with the capability you need. Monitoring, Telemetry, and Reports do not require Robin MTA or a registered fleet of mail services.
Track reachability, email delivery, and availability. Investigate issues, send alerts, and publish a customer-facing status page.
Explore MonitoringBring in Prometheus-compatible infrastructure metrics. Build dashboards, explore with PromQL, and understand resource behavior.
Explore TelemetryUnderstand sending sources, domain conformance, and transport security through DMARC, TLS-RPT, and forensic evidence.
Explore ReportsMove from fleet health to queues, protection, sessions, logs, and managed settings across supported service types.
Explore Fleet OperationsKeep monitoring, metrics, email intelligence, and supported service controls in one operational workspace—without treating an availability check, a resource graph, and a delivery report as the same signal.
See It Running
These captures come from a running Robin suite. Operator and mailbox identities are fictional; mail flow and scanner activity come from synthetic samples processed by real services. Health, monitoring, and resource measurements are actual local observations—not production benchmarks.
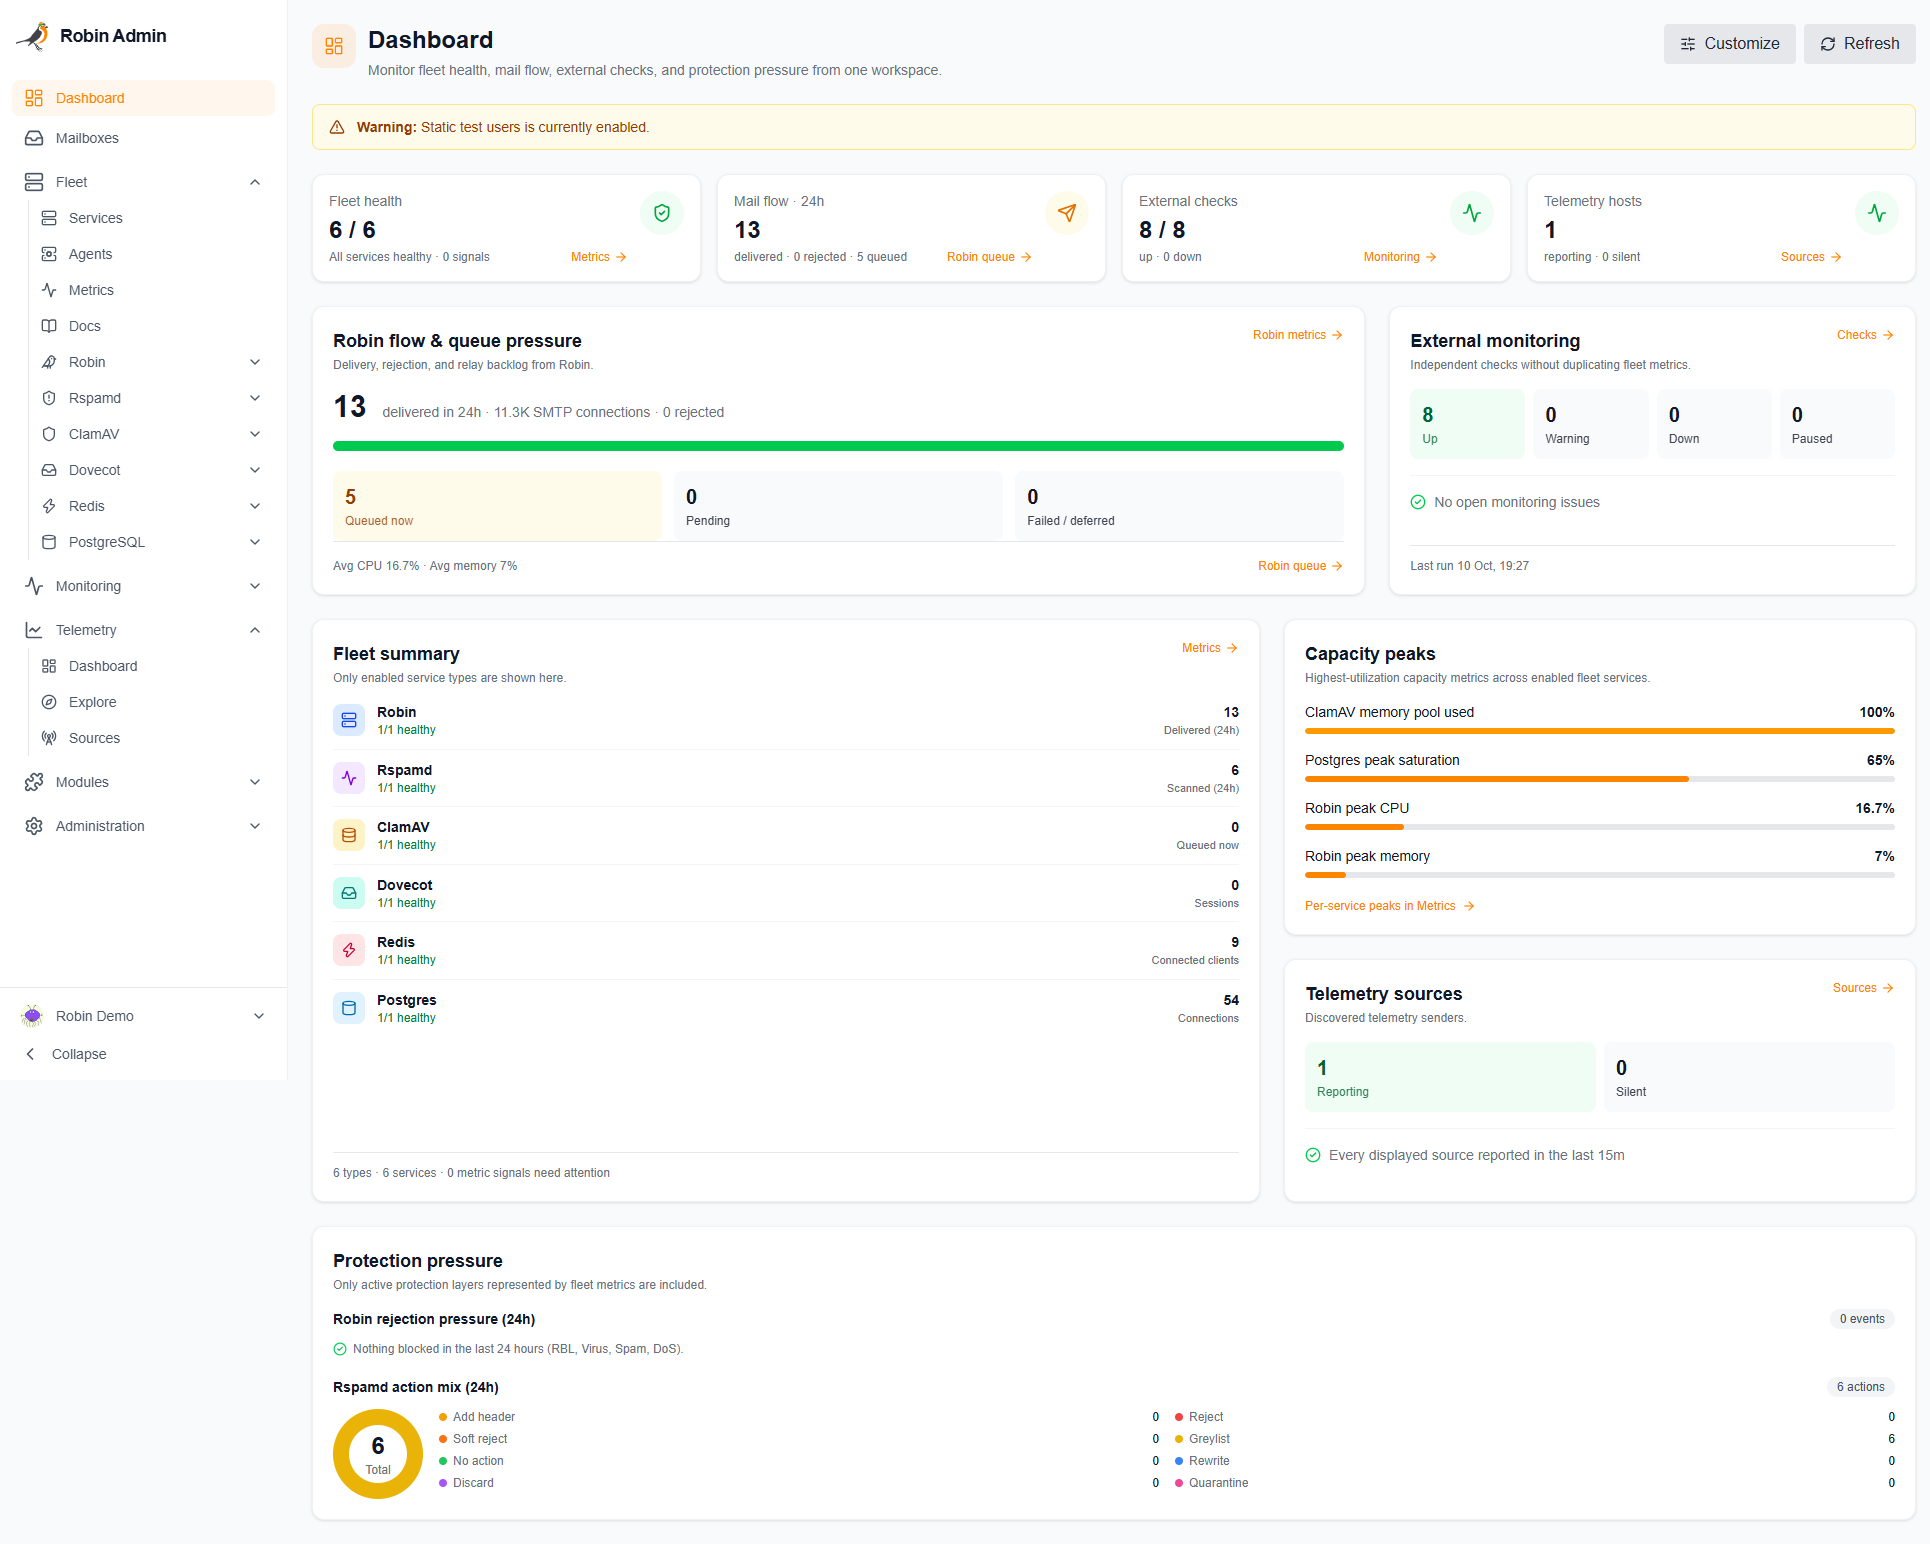
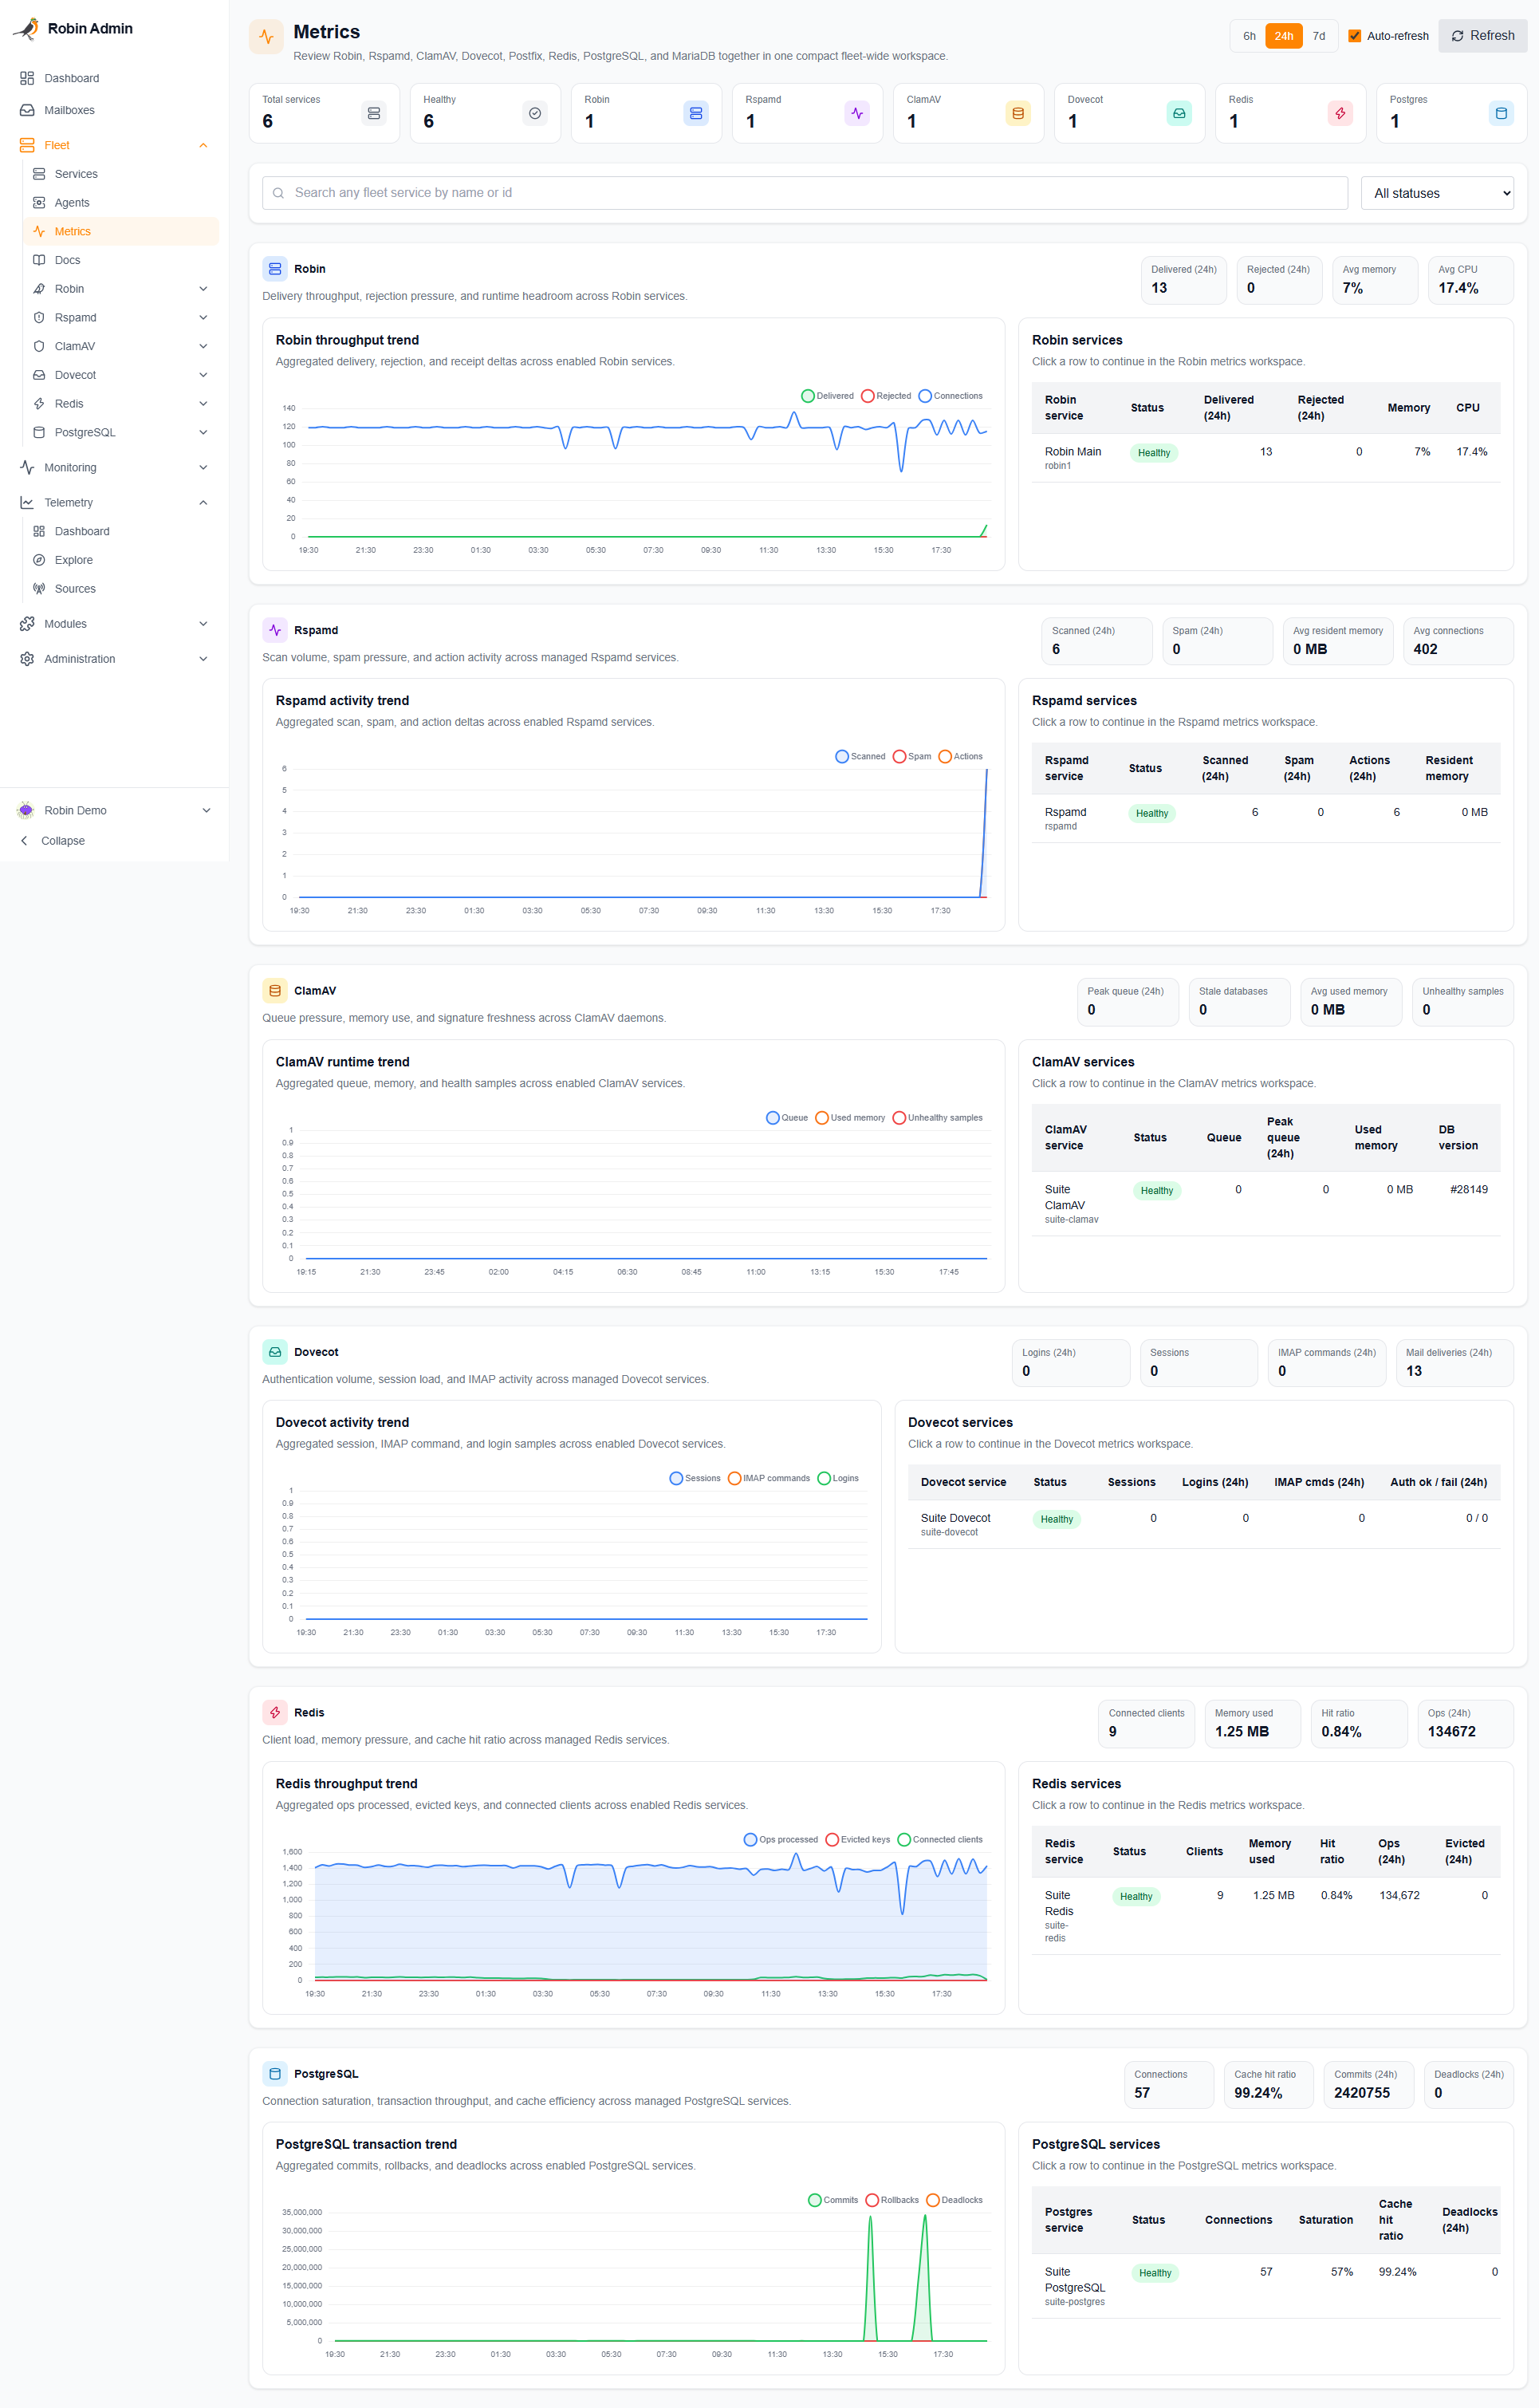
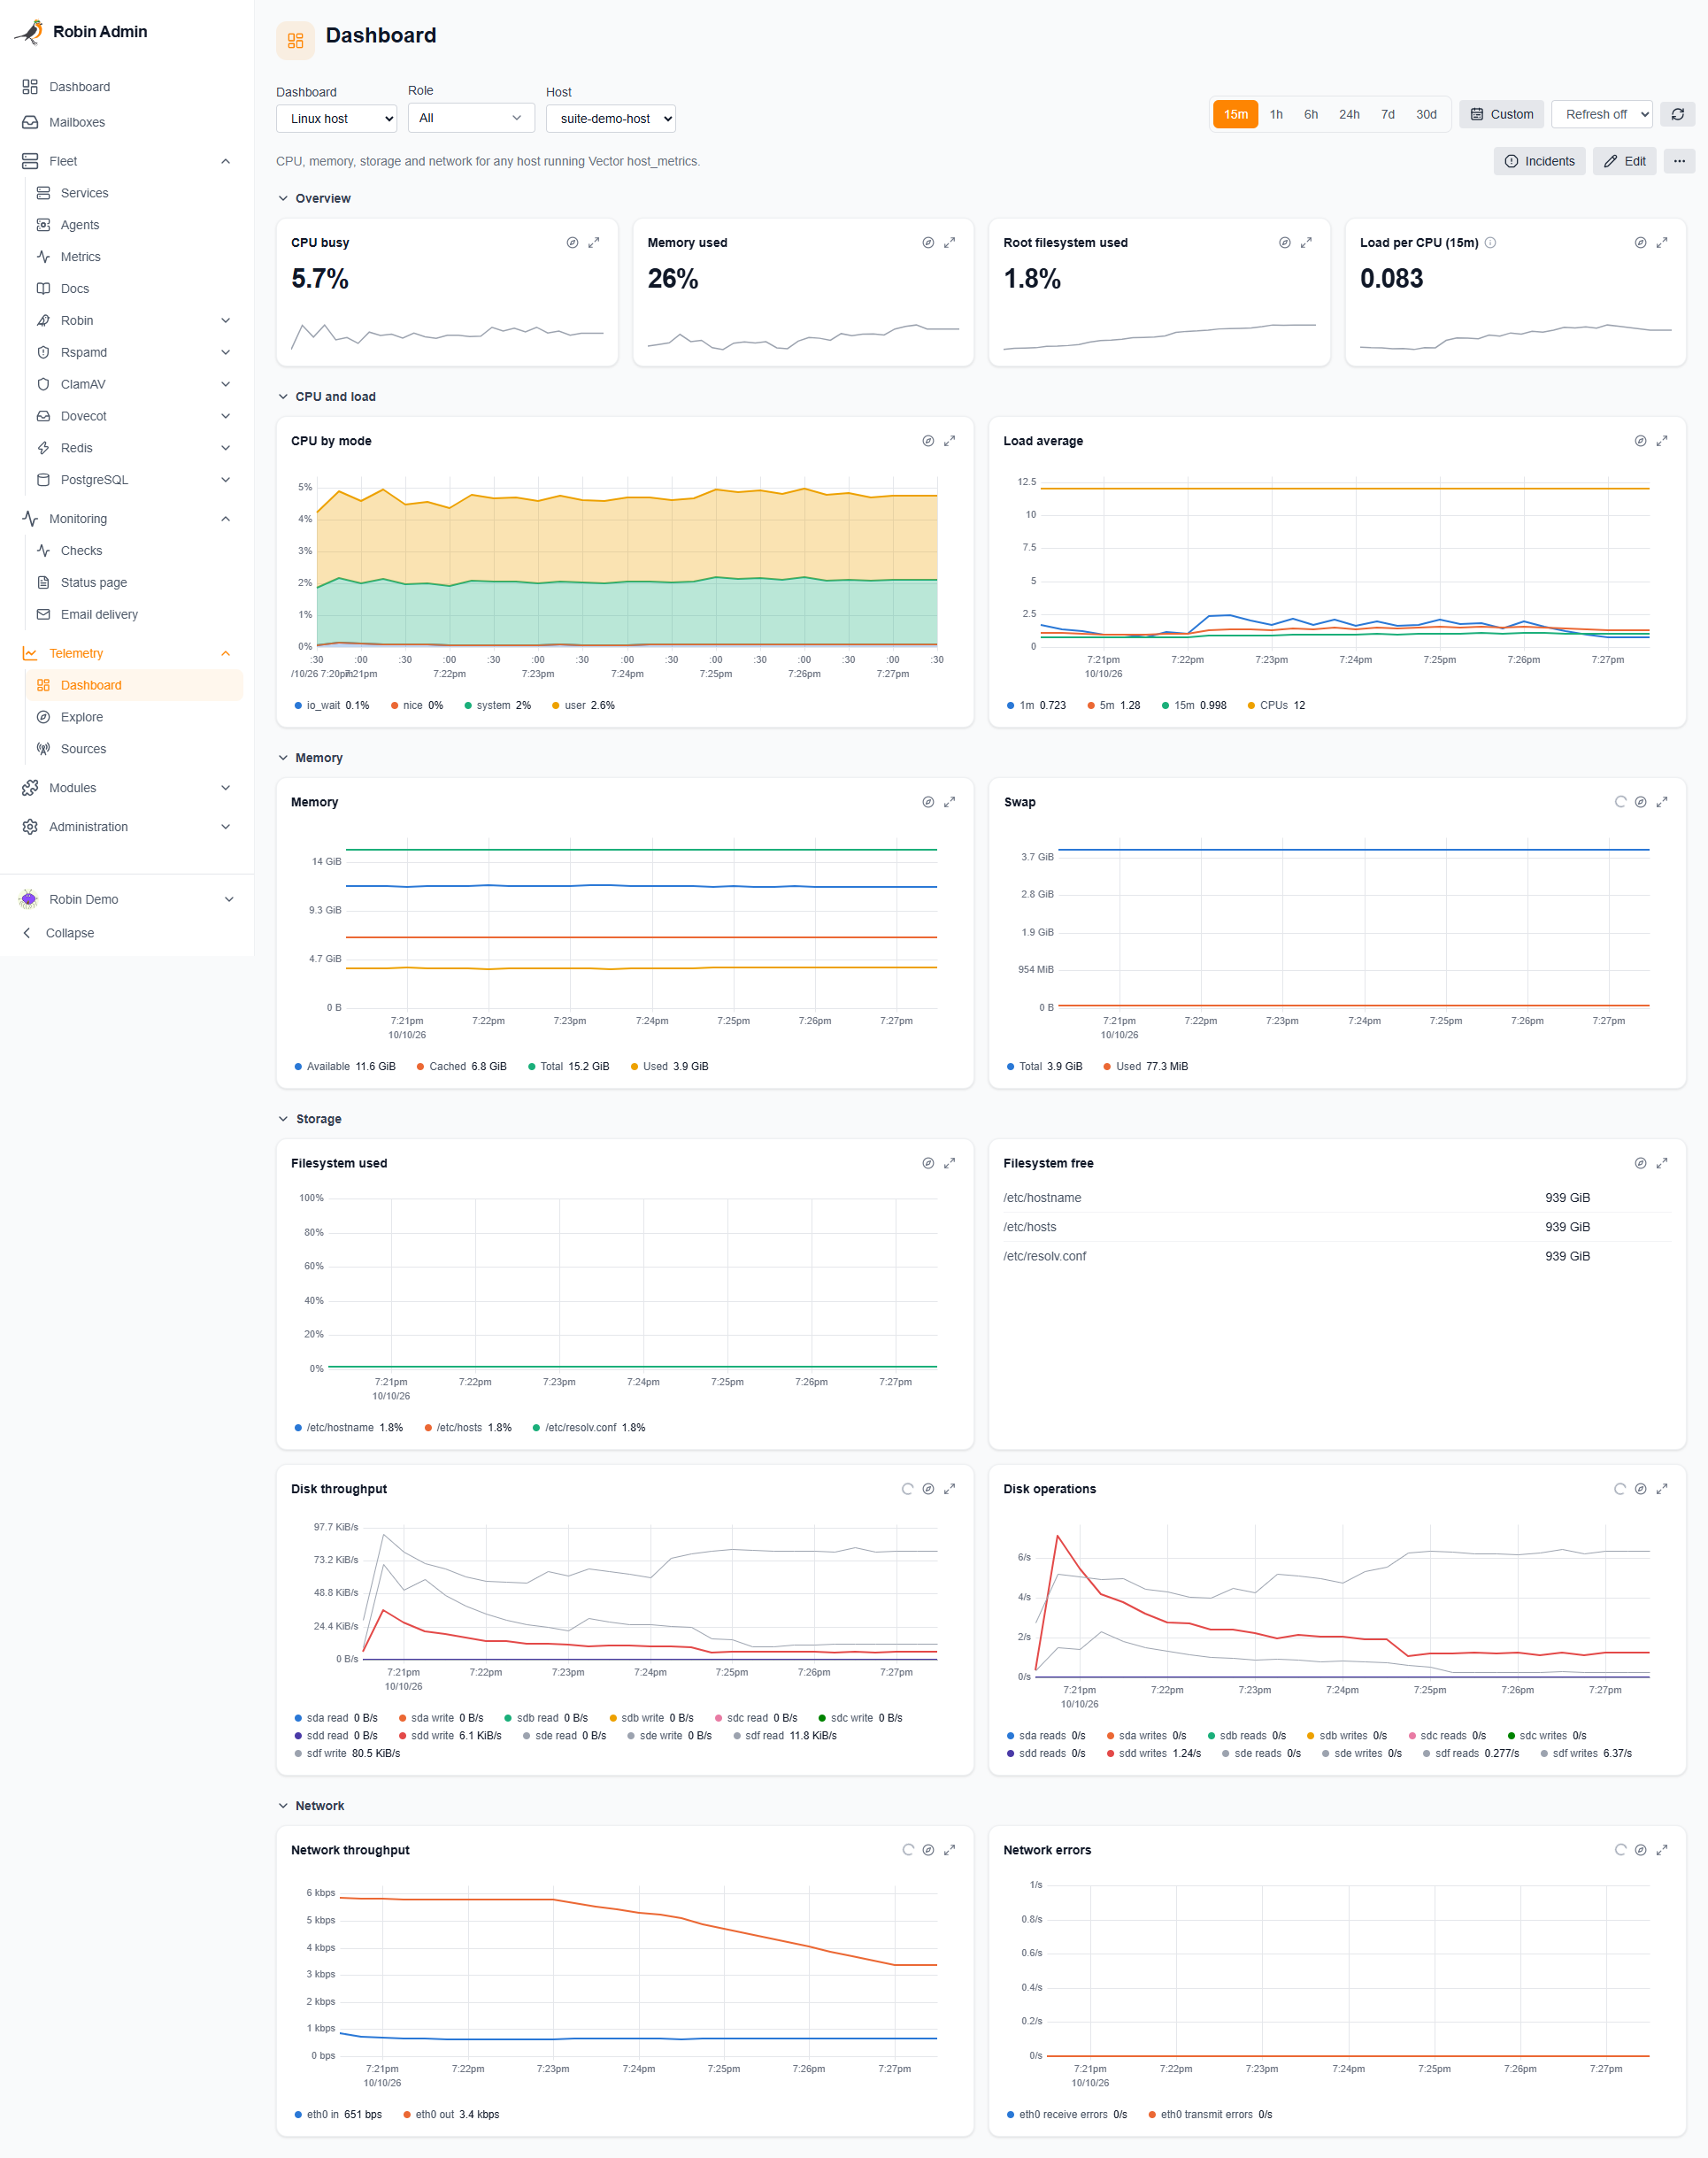
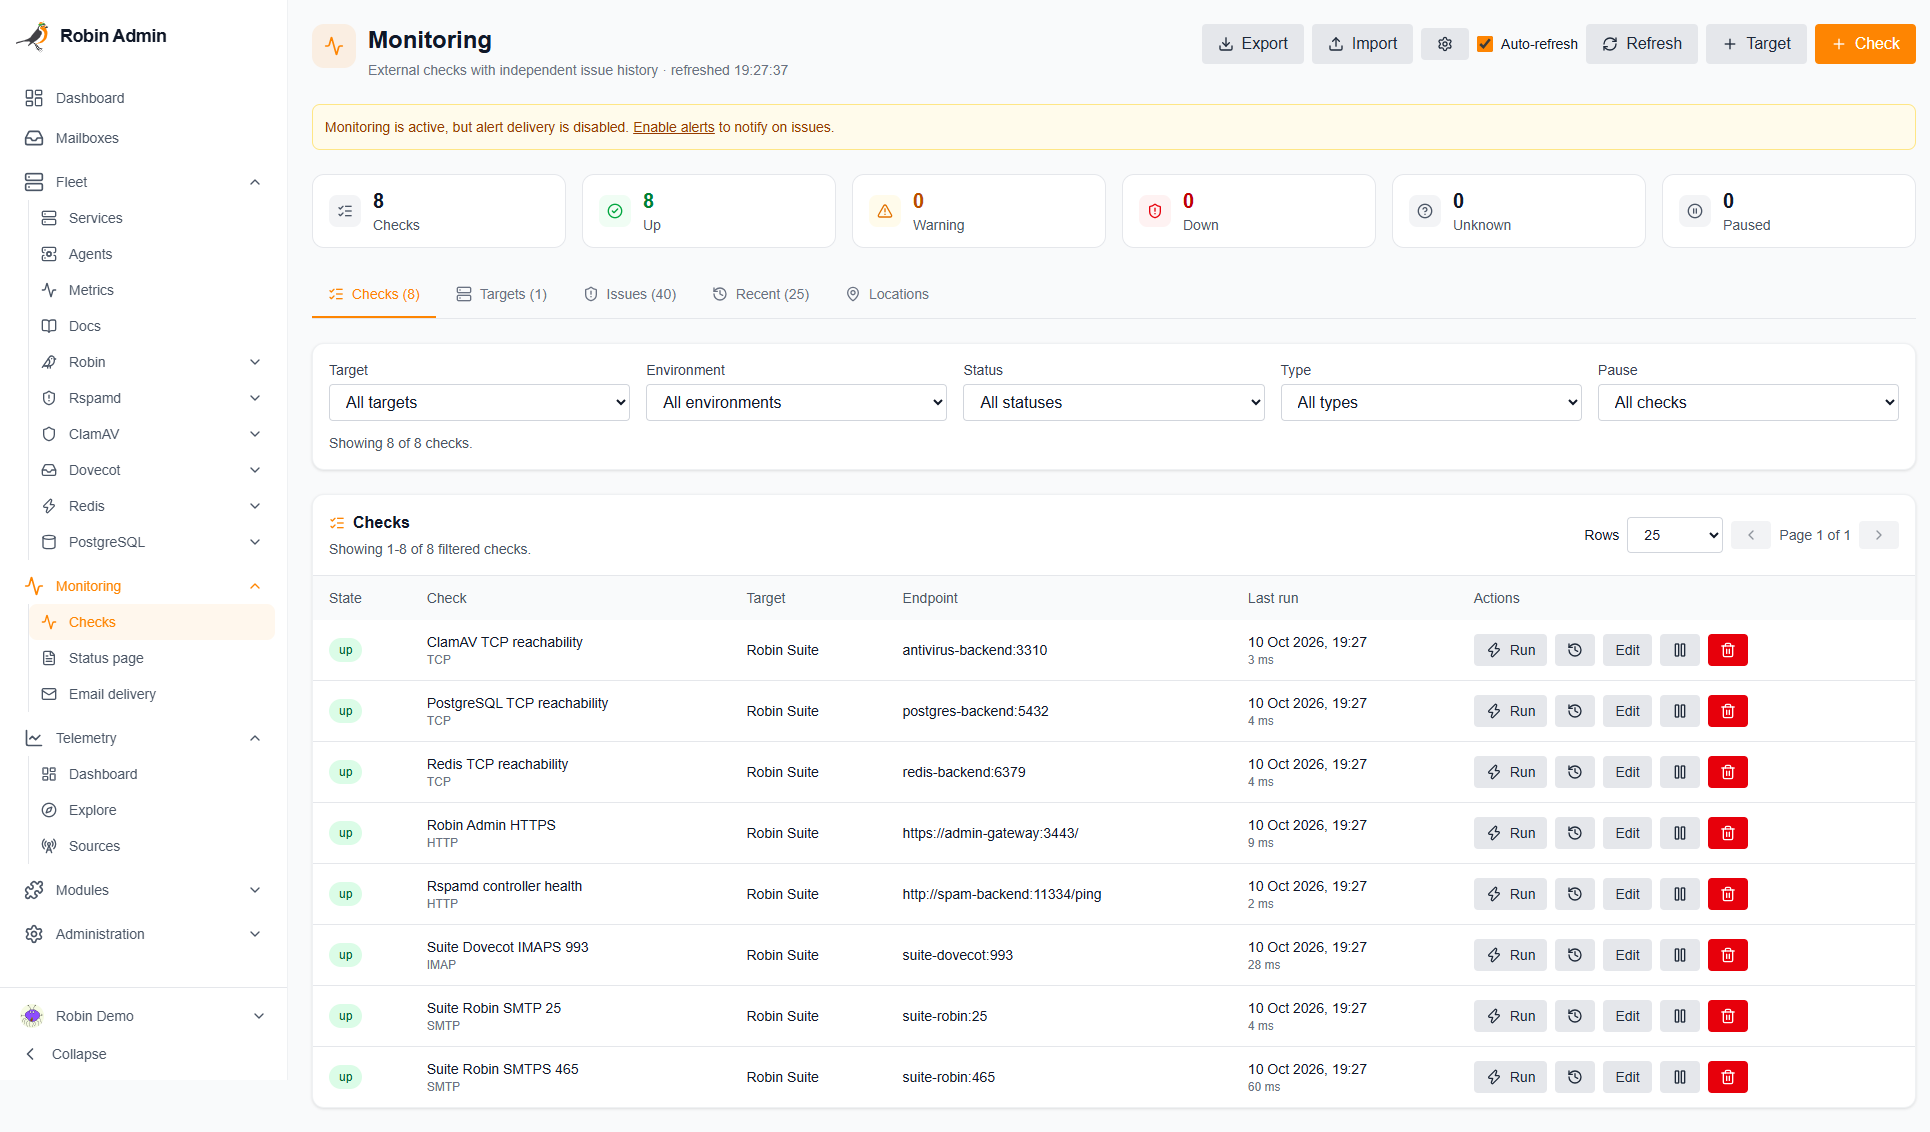
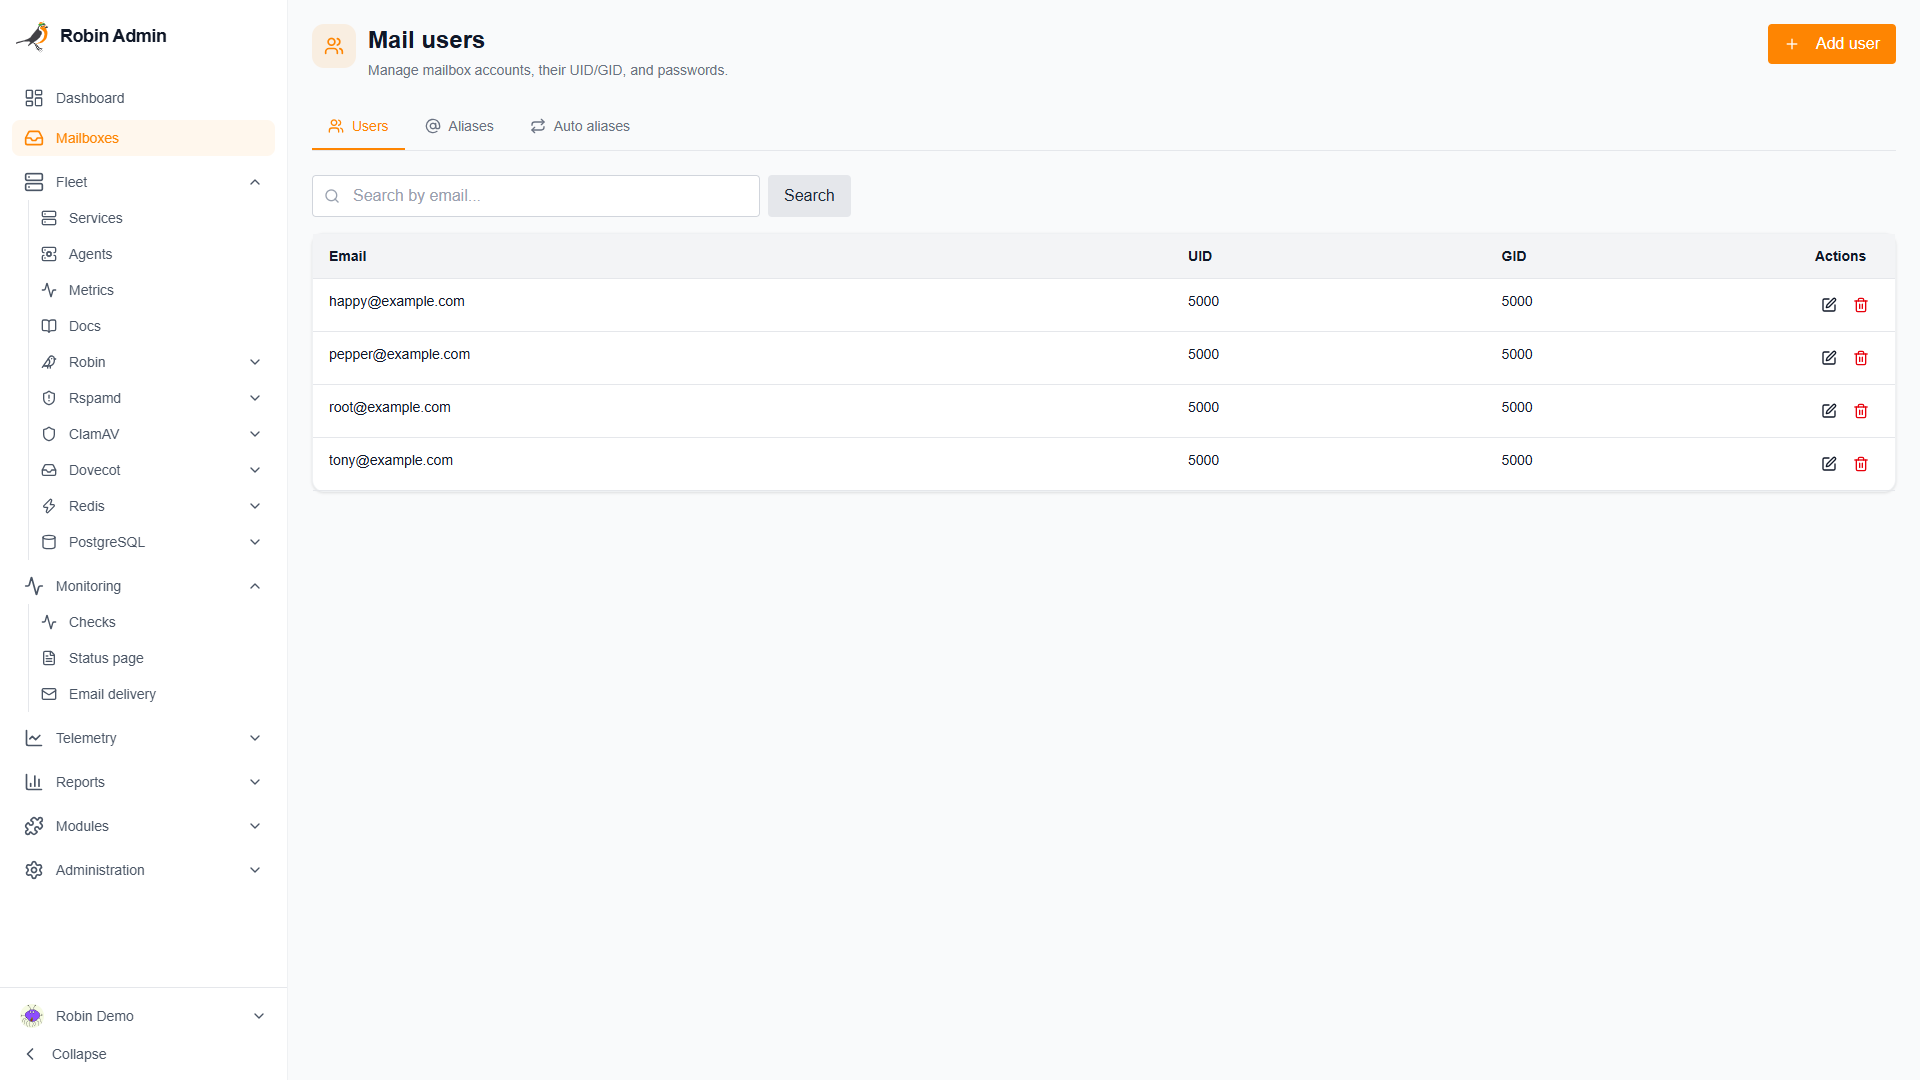
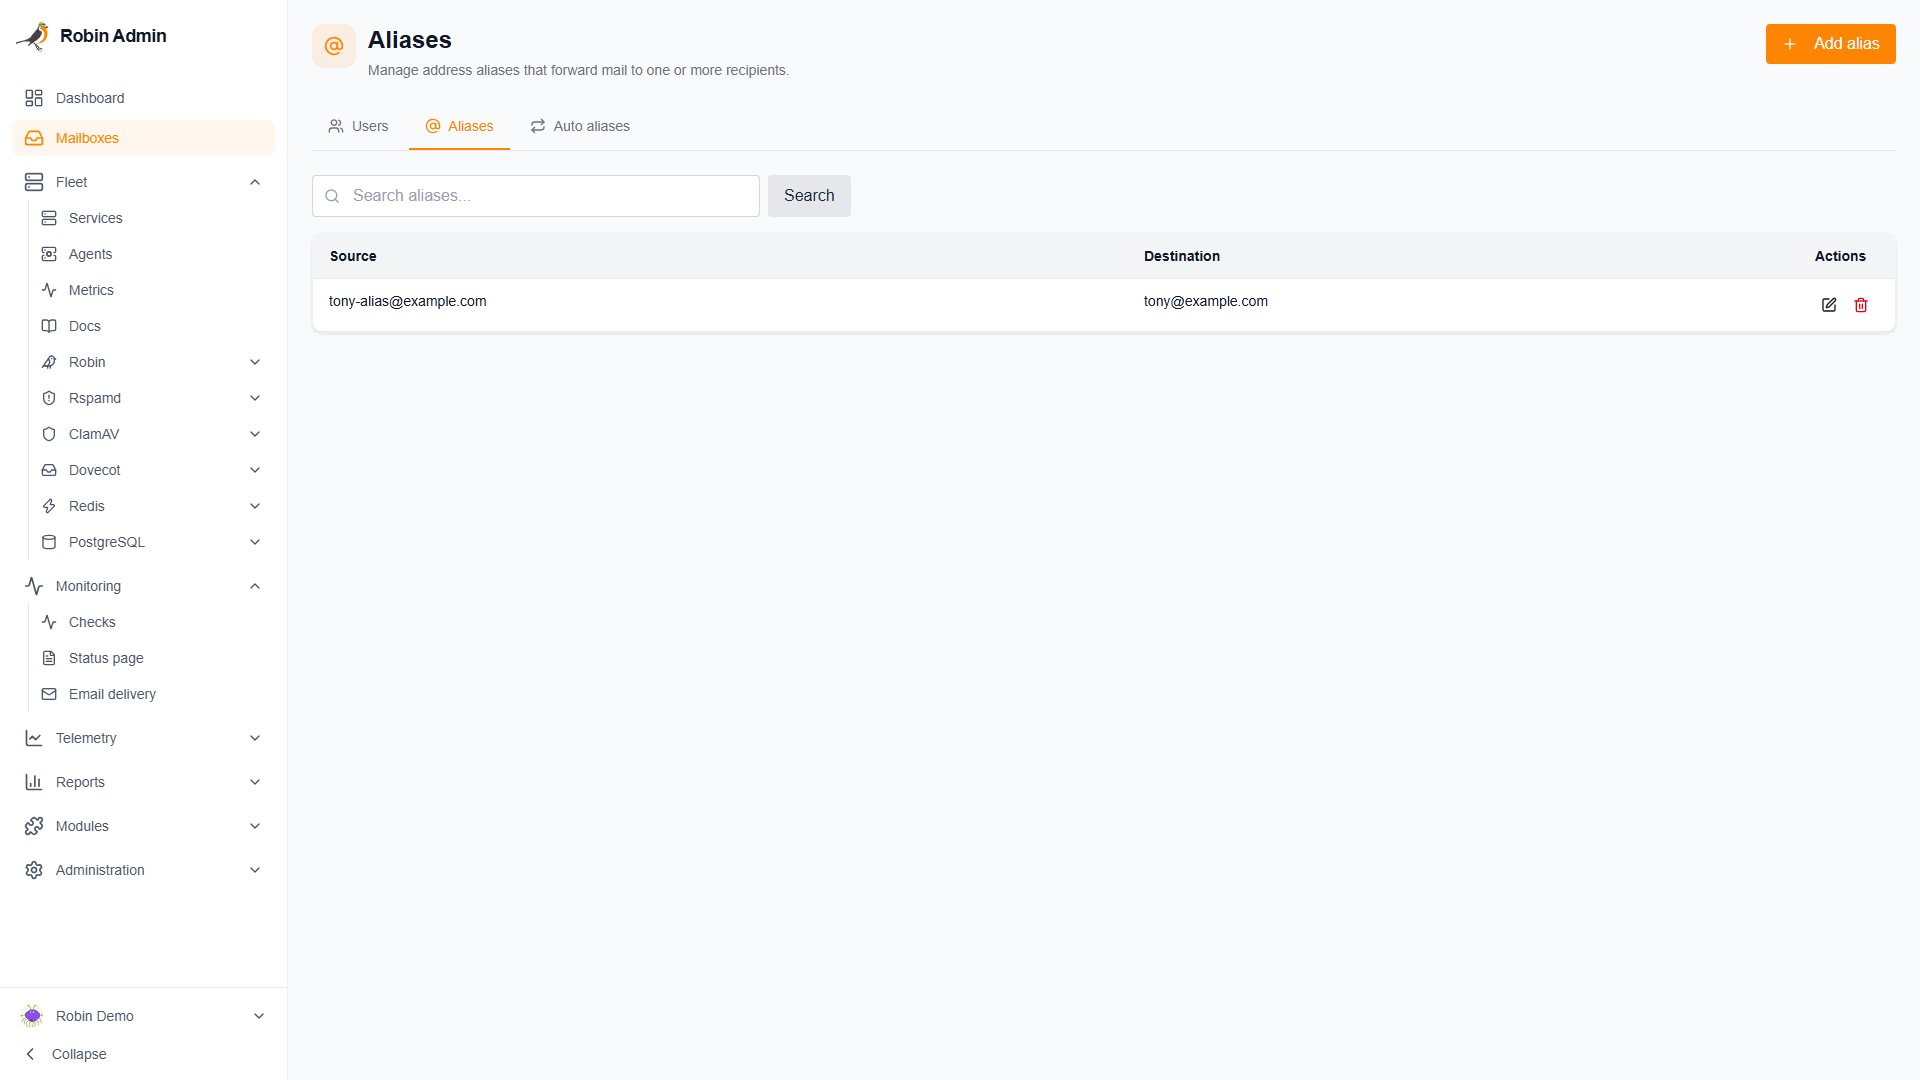
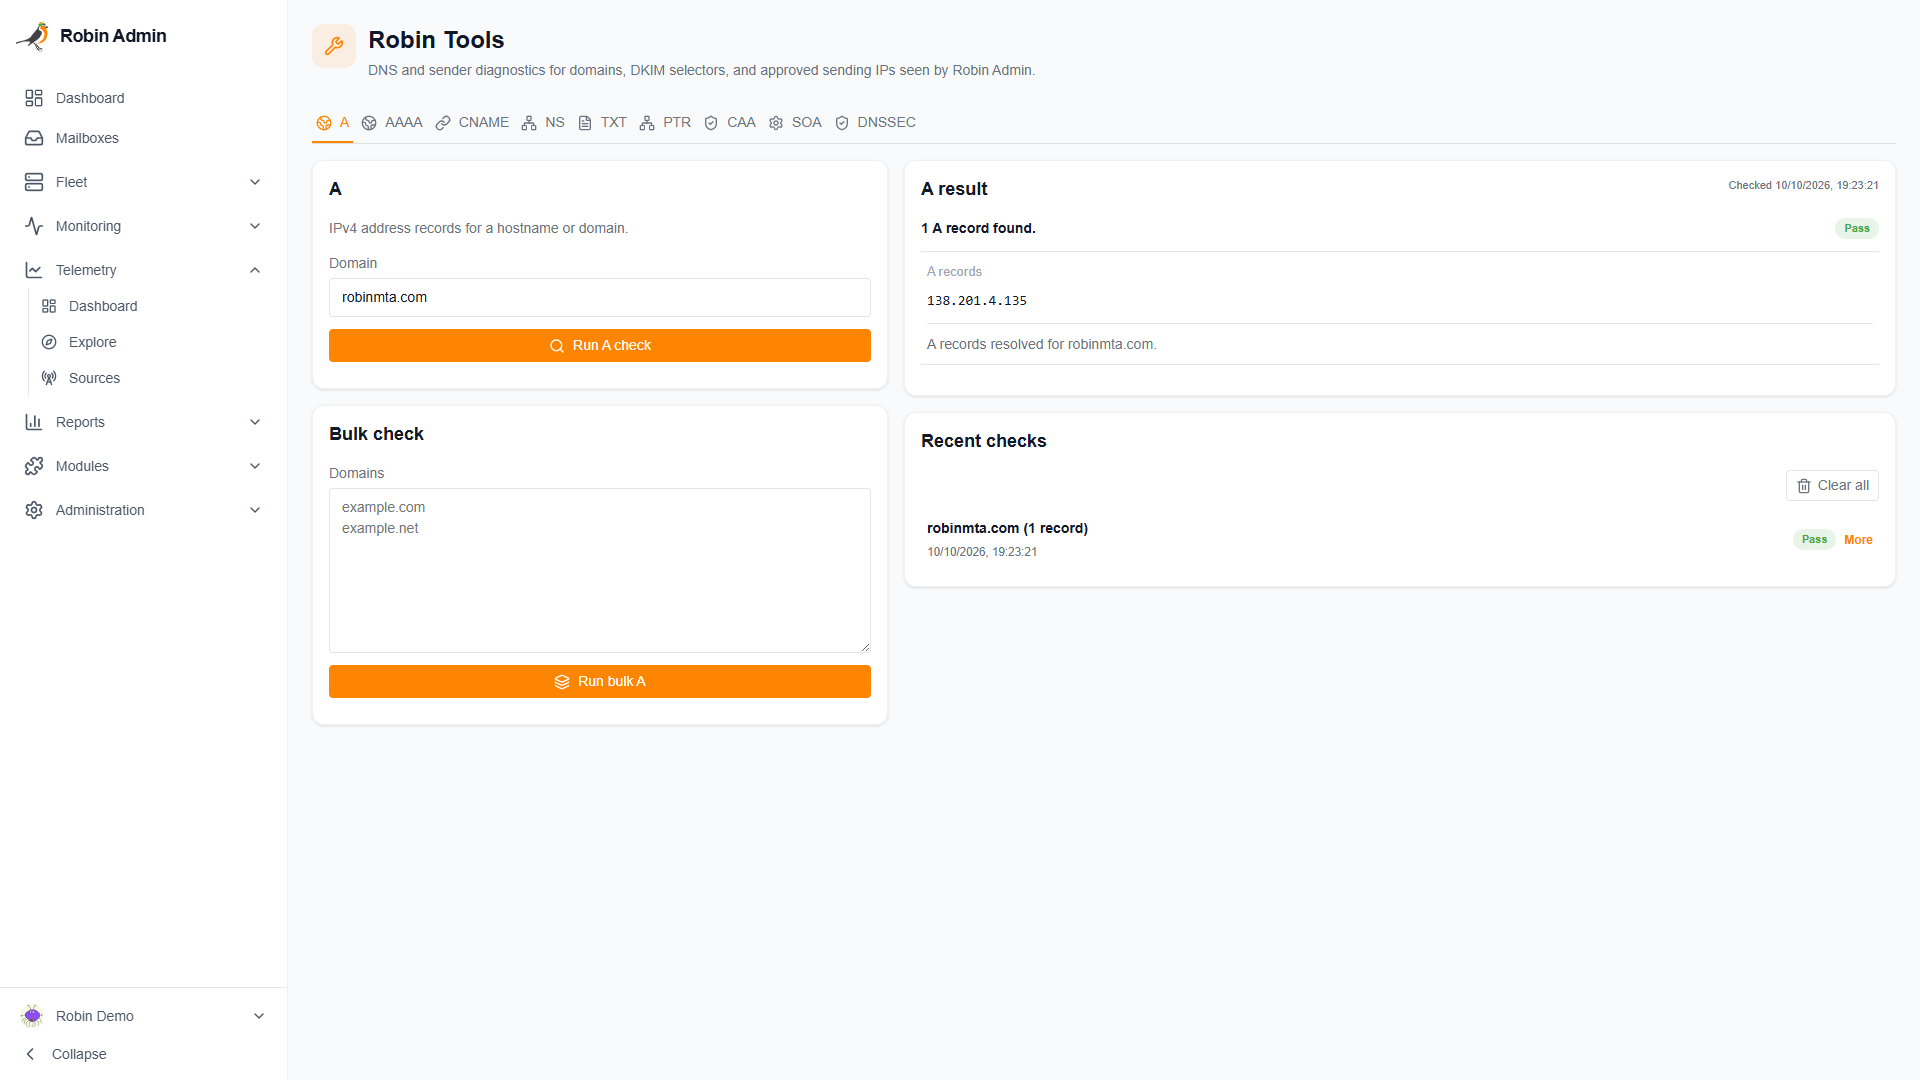
Select any screenshot to inspect the full-resolution capture. Report workspaces are documented below but are not shown in this demo tour.
Fleet Operations
Operate supported mail services with service-specific controls. Combine queues, protection, mailbox administration, and operational settings with fleet-wide health and capacity context.
Manage users, aliases, and auto aliases against your compatible PostgreSQL mailbox tables.
Inspect Robin queues and run delivery tests. Operate Postfix queues, Dovecot sessions, and database services where your deployment supports them.
Work with Rspamd and ClamAV as independent services. Investigate scanner results and manage the supported protection settings.
Your Managed Stack
Connect the Robin suite's services or register supported components from an existing estate. Integrations remain independent; you don't need Robin MTA to operate Rspamd or monitor a Postfix host.
Available capabilities depend on service endpoints, credentials, agent access, and the way services are deployed. Host-side actions need a suitable agent; metrics and logs need a reachable source.
Admin hides unsupported controls rather than presenting a workspace that can't work.
Explore the Capability MatrixManage operational settings with shared defaults and per-instance overrides. Connect mailbox administration to your PostgreSQL account tables.
Mailbox Integration GuideMonitoring & Incident Management
Monitor external endpoints and email delivery independently of Fleet metrics. Follow availability and response-time history, investigate issues, and configure alert delivery.
General-Purpose Telemetry
Explore infrastructure metrics beyond the mail stack. Collectors such as Vector push Prometheus-compatible samples; Admin gives operators a workspace to discover sources, build dashboards, and query with PromQL.
DMARC & TLS Reporting Intelligence
Make email authentication and transport-security reports useful to operators. Investigate sending sources, domain conformance, and TLS posture without needing Robin MTA to handle your mail.
Use reporting intelligence to review sender inventory, examine domain posture, triage issues, and plan remediation.
Keep raw report workspaces alongside the intelligence layer. Inspect the underlying records when a summary is not enough.
Reports require configured ingestion and report data. Report screenshots are not included in this tour.
Reporting Intelligence & Evidence GuideOperator Access
Role-aware navigation, scoped API keys, session authentication, configurable access policies, and activity history support accountable administration.
Add diagnostics without leaving your administrative workflow. Robin Tools runs as a separately deployed module; Admin provides navigation, authenticated proxying, and operator identity.
The module appears when its runtime is reachable and the required trust and proxy configuration is in place.
Explore Robin Tools Module Setup GuideDeployment
Deploy independently for monitoring, telemetry, or email reporting. Connect an existing mail estate when you need fleet controls—or join the Robin suite. Admin runs with an HTTPS gateway, UI, API, PostgreSQL connectivity, and bundled telemetry storage.
Start the mail stack first, then deploy Admin with its suite overlay to join the shared network and connect to the suite's database and services.
docker compose -f docker-compose.yaml -f docker-compose.suite.yaml up -dStart with the standalone layout and its own database. Enable Monitoring and configure checks, enable Telemetry and connect collectors, or configure report ingestion. No mail fleet or Robin MTA is required for those workspaces.
For service operations, register supported services and configure their access. A host-networked layout is also available for existing mail hosts.
docker compose up -dThe getting-started guide walks through deployment, first-boot setup, service connections, and capability configuration.
Independent by Design
Use the capabilities you need. Add the Robin suite for self-hosted mail infrastructure, or Robin Tools for interactive diagnostics.